We received a further analysis from our friend Koji Hoga Miura, biomechanist of the Japan National Race Walking Team, detailed with graphs on the subject already published on January 3, 2021.
This too, like the previous one, is fully proposed to our readers so that they can form a profound opinion.
Introductions
On the three dimensional data-sets on the official race-walking race including my Ph.D study in the University of Tsukuba, Ibaraki, Japan, until 2007, it is possible to verify the assumption that the boundary between race-walking and running could be recognized with another clearer view point other than the contacts with the ground.
We made hypotheses by reference to the previous research on the difference between normal-walking and running:
1) On race-walking, the hip joint starts to flex and swing-forward before Toe-off, which starts flex and swing-forward after Toe-off in running.
2) On race-walking, the knee joint keep extension and swing forward at Heel-contact, which start flexion and swing backward before Heel(Foot)-contact in running.
However, for the adoption to the practical competition management, it is important to avoid the confusion in athletes, coaches and officials. So, the verification for these assumption was conducted to keep consistency to the current judgement and record.
Data
Verification for these assumptions
Two kinds of data were chosen to explain the results.
(1) Thigh angular velocity for one locomotion cycle (Heel-on – Toe-off – Heel-on) for men and women, these reflect the kinematics of hip joint.
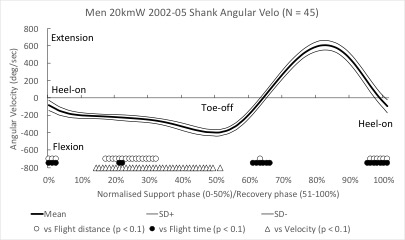
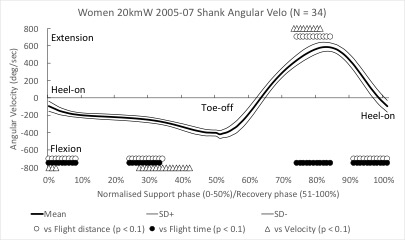
(2) Shank angular velocity for one locomotion cycle (Heel-on – Toe-off – Heel-on) for men and women, these reflect the kinematics of knee joint.
(1.1) These two graphs (Above for men, below for women) displays the Thigh angular velocities for men and women in my data-sets, including Olympic and World champions in these period (2002-07). These data reflect the kinematics (Flexion and Extension) of hip joint in the sagittal plane.
Both on these data, the angular velocities about Toe-off significantly related both to Flight distance and Flight time. That means that the faster hip joint flexes about Toe-off, the shorter distance the athlete progresses forward in the flight (Loss of contact) phase, and the shorter time the athlete makes flight phase.
(2.1) As the thigh angular velocities, another these two graphs displays the Shank angular velocities for men and women in my data-sets. These data reflect the kinematics (Extension and Flexion) of knee joint in the sagittal plane.
Both on these data, the angular velocities before Heel-on significantly related both to Flight distance and Flight time. That means that the faster knee joint extends Before Heel-on, the shorter distance the athlete progresses forward in the flight (Loss of contact) phase, and the shorter time the athlete makes flight phase.


From these data above, our two assumption could be verified for the recognition of the current definition of race walking mentioned in current technical rules, that keep contact to the ground or not. However, these other viewpoints of our assumption may be easier to educate officials to judge race walking competitions.
Practical Judgement
In addition to the relationships to the flight distance and flight time,
the practical judgement was investigated.
These kind data were shown below.
(1) Compare No-red card and More that 2 red cards athletes on women’ 20kmW on the world championships in 2005 and 2007 (The number of disqualified athletes who have higher PB was very small).
(2) Compare No-red card and Disqualified athletes on men’ 20kmW on the Olympics in 2004, world championships in 2005 and 2007.
On practical races, technics of participants vary in each races. So, the results of practical judgement were different in genders. The difference of hip flexion angular velocity were detected in the data comparison between No-Red card and More than two red cards on women’ 20kmW. However, the difference in knee extension before Heel-on were detected in the data comparison between No-Red card and Disqualified athletes.
However, the assumptions above mentioned seems to be consistent to the practical current judgement.
All graph in larger resolution
The graph of figures 2 and 4 (men) in larger resolution: click here
The graph of figures 1 and 3 (women) in larger resolution: click here
The graphs of other figures (analysis various events men and women) in larger resolution: click here